Little Beehive Cluster
2025Photometric and parallax analysis of the open cluster M41, using data captured from McDonald Observatory and cross-referenced with SIMBAD/GAIA satellite data.
Project Description
For my ASTR 230 final project, I studied the young open cluster M41 — also known as the "Little Beehive Cluster" — to test the hypothesis that it would be denser, heavier, and hotter near the center. Using photometric data I captured via McDonald Observatory's 0.8m Prime Focus Corrector (PFC) Telescope and parallax data from SIMBAD, I performed aperture photometry, generated color-magnitude diagrams, and analyzed the radial distribution of cluster members to characterize the cluster's structure and stellar population.
Observation
Data was captured during two separate remote observing sessions (3/29/2025 and 3/31/2025) with McDonald Observatory's 0.8m Prime Focus Corrector (PFC) Telescope. We captured images across multiple bands and exposure times to ensure both dim background stars and bright foreground stars would get accurate photometric readings:
- B Band — 20s and 60s exposures
- V Band — 3s, 7s, and 20s exposures
- R Band — 4s and 10s exposures
We encountered significant cloud cover on the first night (3/29), so almost all of that data was discarded. Three reasonably solid V Band images from early in the night were kept to ensure a minimum of 3 images existed for each setting. The rest of the usable data came from the clearer second night (3/31).
Data Processing
Reduction
Calibration files were provided by McDonald. Dark frames were not needed given the PFC's cryogenic cooling, but the median bias was subtracted and normalized flats were divided out to produce higher quality images.
Aligning & Combining
All images from the same band + exposure time setting were combined to form 7 distinct images (one for each configuration). Alignment was done via brightest-pixel-matching, which worked well due to the high luminosity of a particular star in the upper-right corner of every image and the lack of any bright cosmic rays in the data. This was an imperfect solution but worked well enough for photometric analysis.
Stellar Detection & Aperture Photometry
Star positions were identified using DAOStarFinder (from Python's photutils package) with the threshold set above 100 counts and an expected FWHM of 4 pixels. This returned approximately 1000–2000 possible star locations per image depending on exposure time and band.
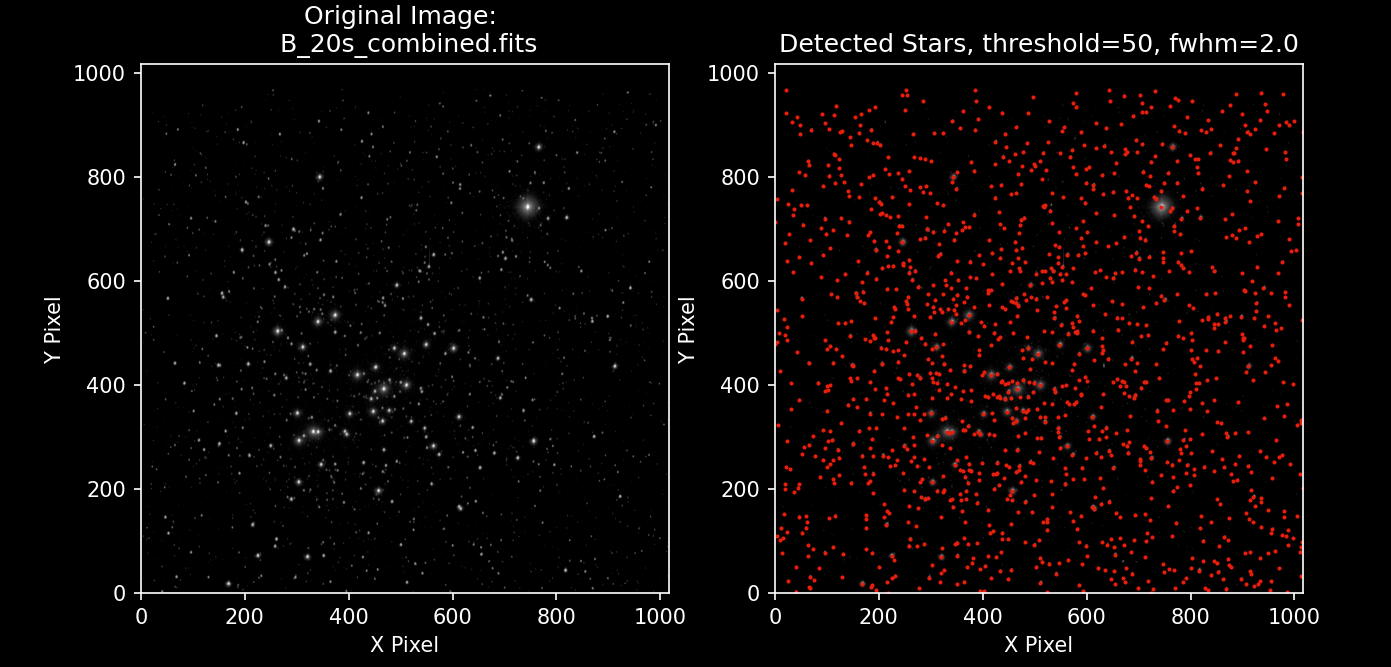
Original image vs detected star positions overlaid.
After finding pixel coordinates, aperture photometry was run on each star using photutils to create a circular aperture and annulus on each position and compute the approximate counts. Counts were then converted to apparent magnitude, calibrated using the standard candles HD 48924 (9.36V, 9.28B) and CPD-20 1613 (10.08R). To account for differences in apparent magnitude between exposure times, the median apparent magnitude across each band was used.
WCS Generation & Star Identification
As the data did not come with WCS (World Coordinate System) information, I generated a WCS for each image manually based on the positions of 20 known stars visible in every image (positions found via SIMBAD). This allowed me to convert pixel positions to RA/DEC coordinates.
After obtaining RA/DEC coordinates for each star, I cross-referenced them with a SIMBAD query of a 40' radius around the image to identify matching coordinate pairs (difference < 0.003 degrees) with known parallax data. This identified 445 known stars in the images with distances for each. By fitting a Gaussian distribution to the distance data, the cluster location became apparent. Stars were classified by their sigma value: likely cluster members (σ < 1) versus unlikely members (σ > 3).
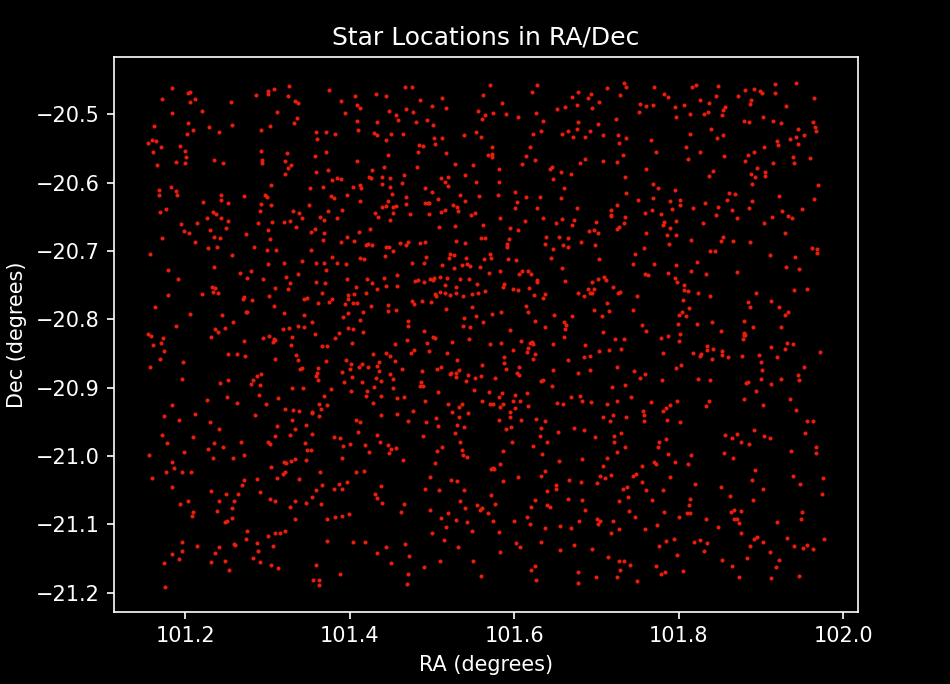
RA/DEC locations of stars in the B 60s combined image.
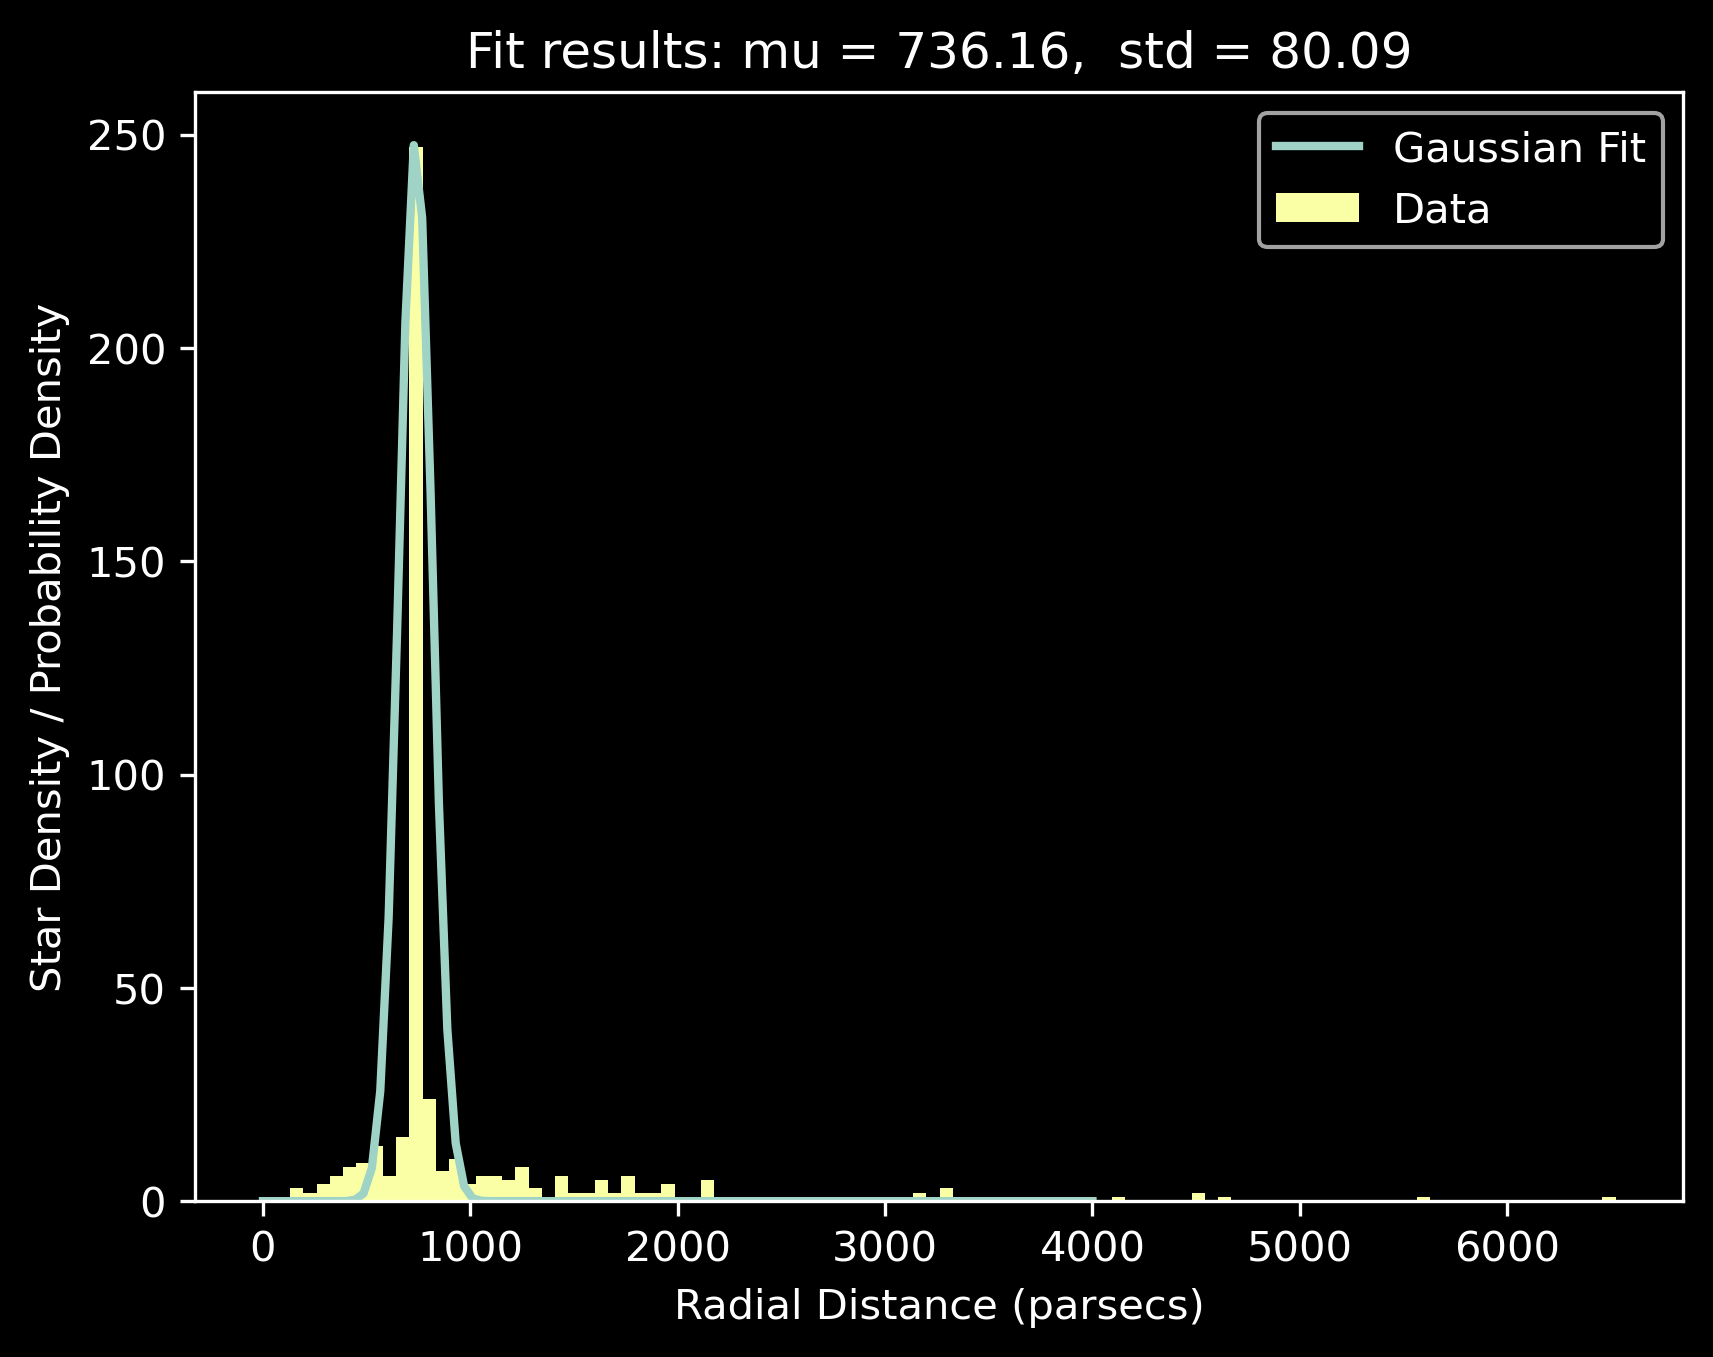
Distance distribution with Gaussian fit. The cluster peak is clearly visible.
Absolute Magnitude & Color
With known distances and observed apparent magnitudes for the 445 identified stars, absolute magnitudes could be estimated via straightforward distance-magnitude conversion. Color analysis was performed using B-V and V-R color index values. The B-V index was used as the primary color metric as the results were qualitatively near-identical when examined under V-R.
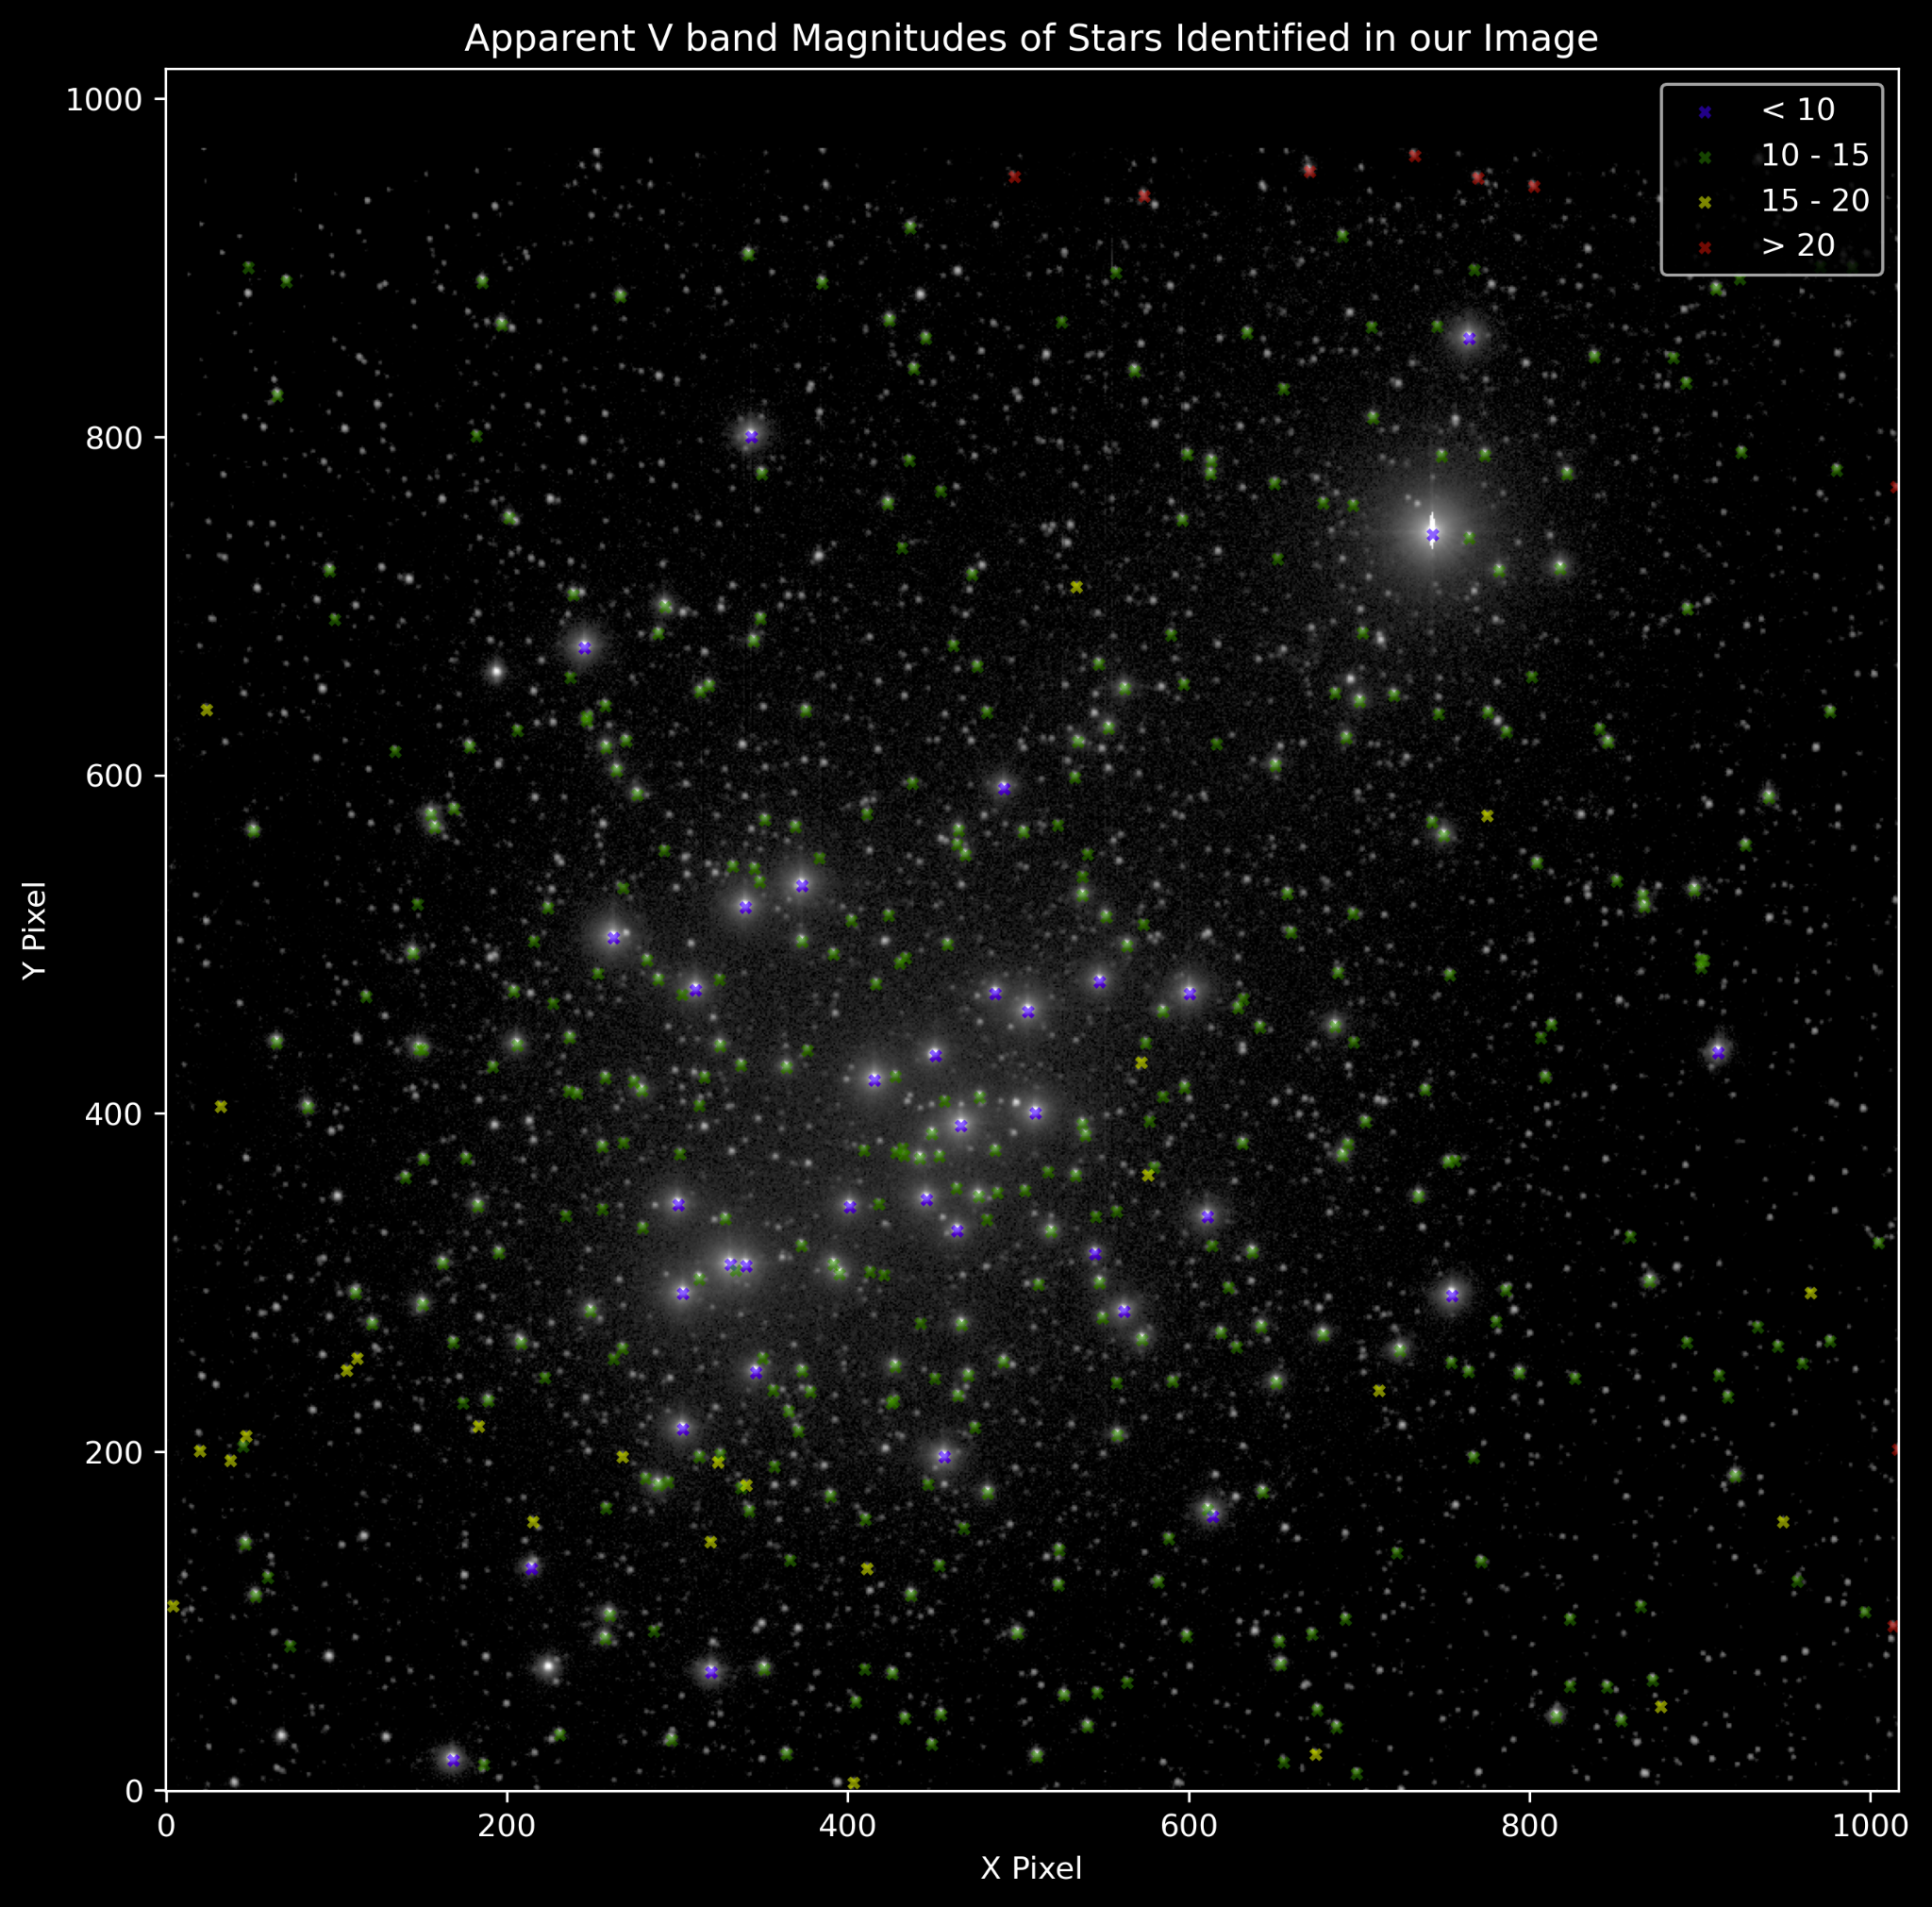
Apparent V band magnitudes of detected stars.
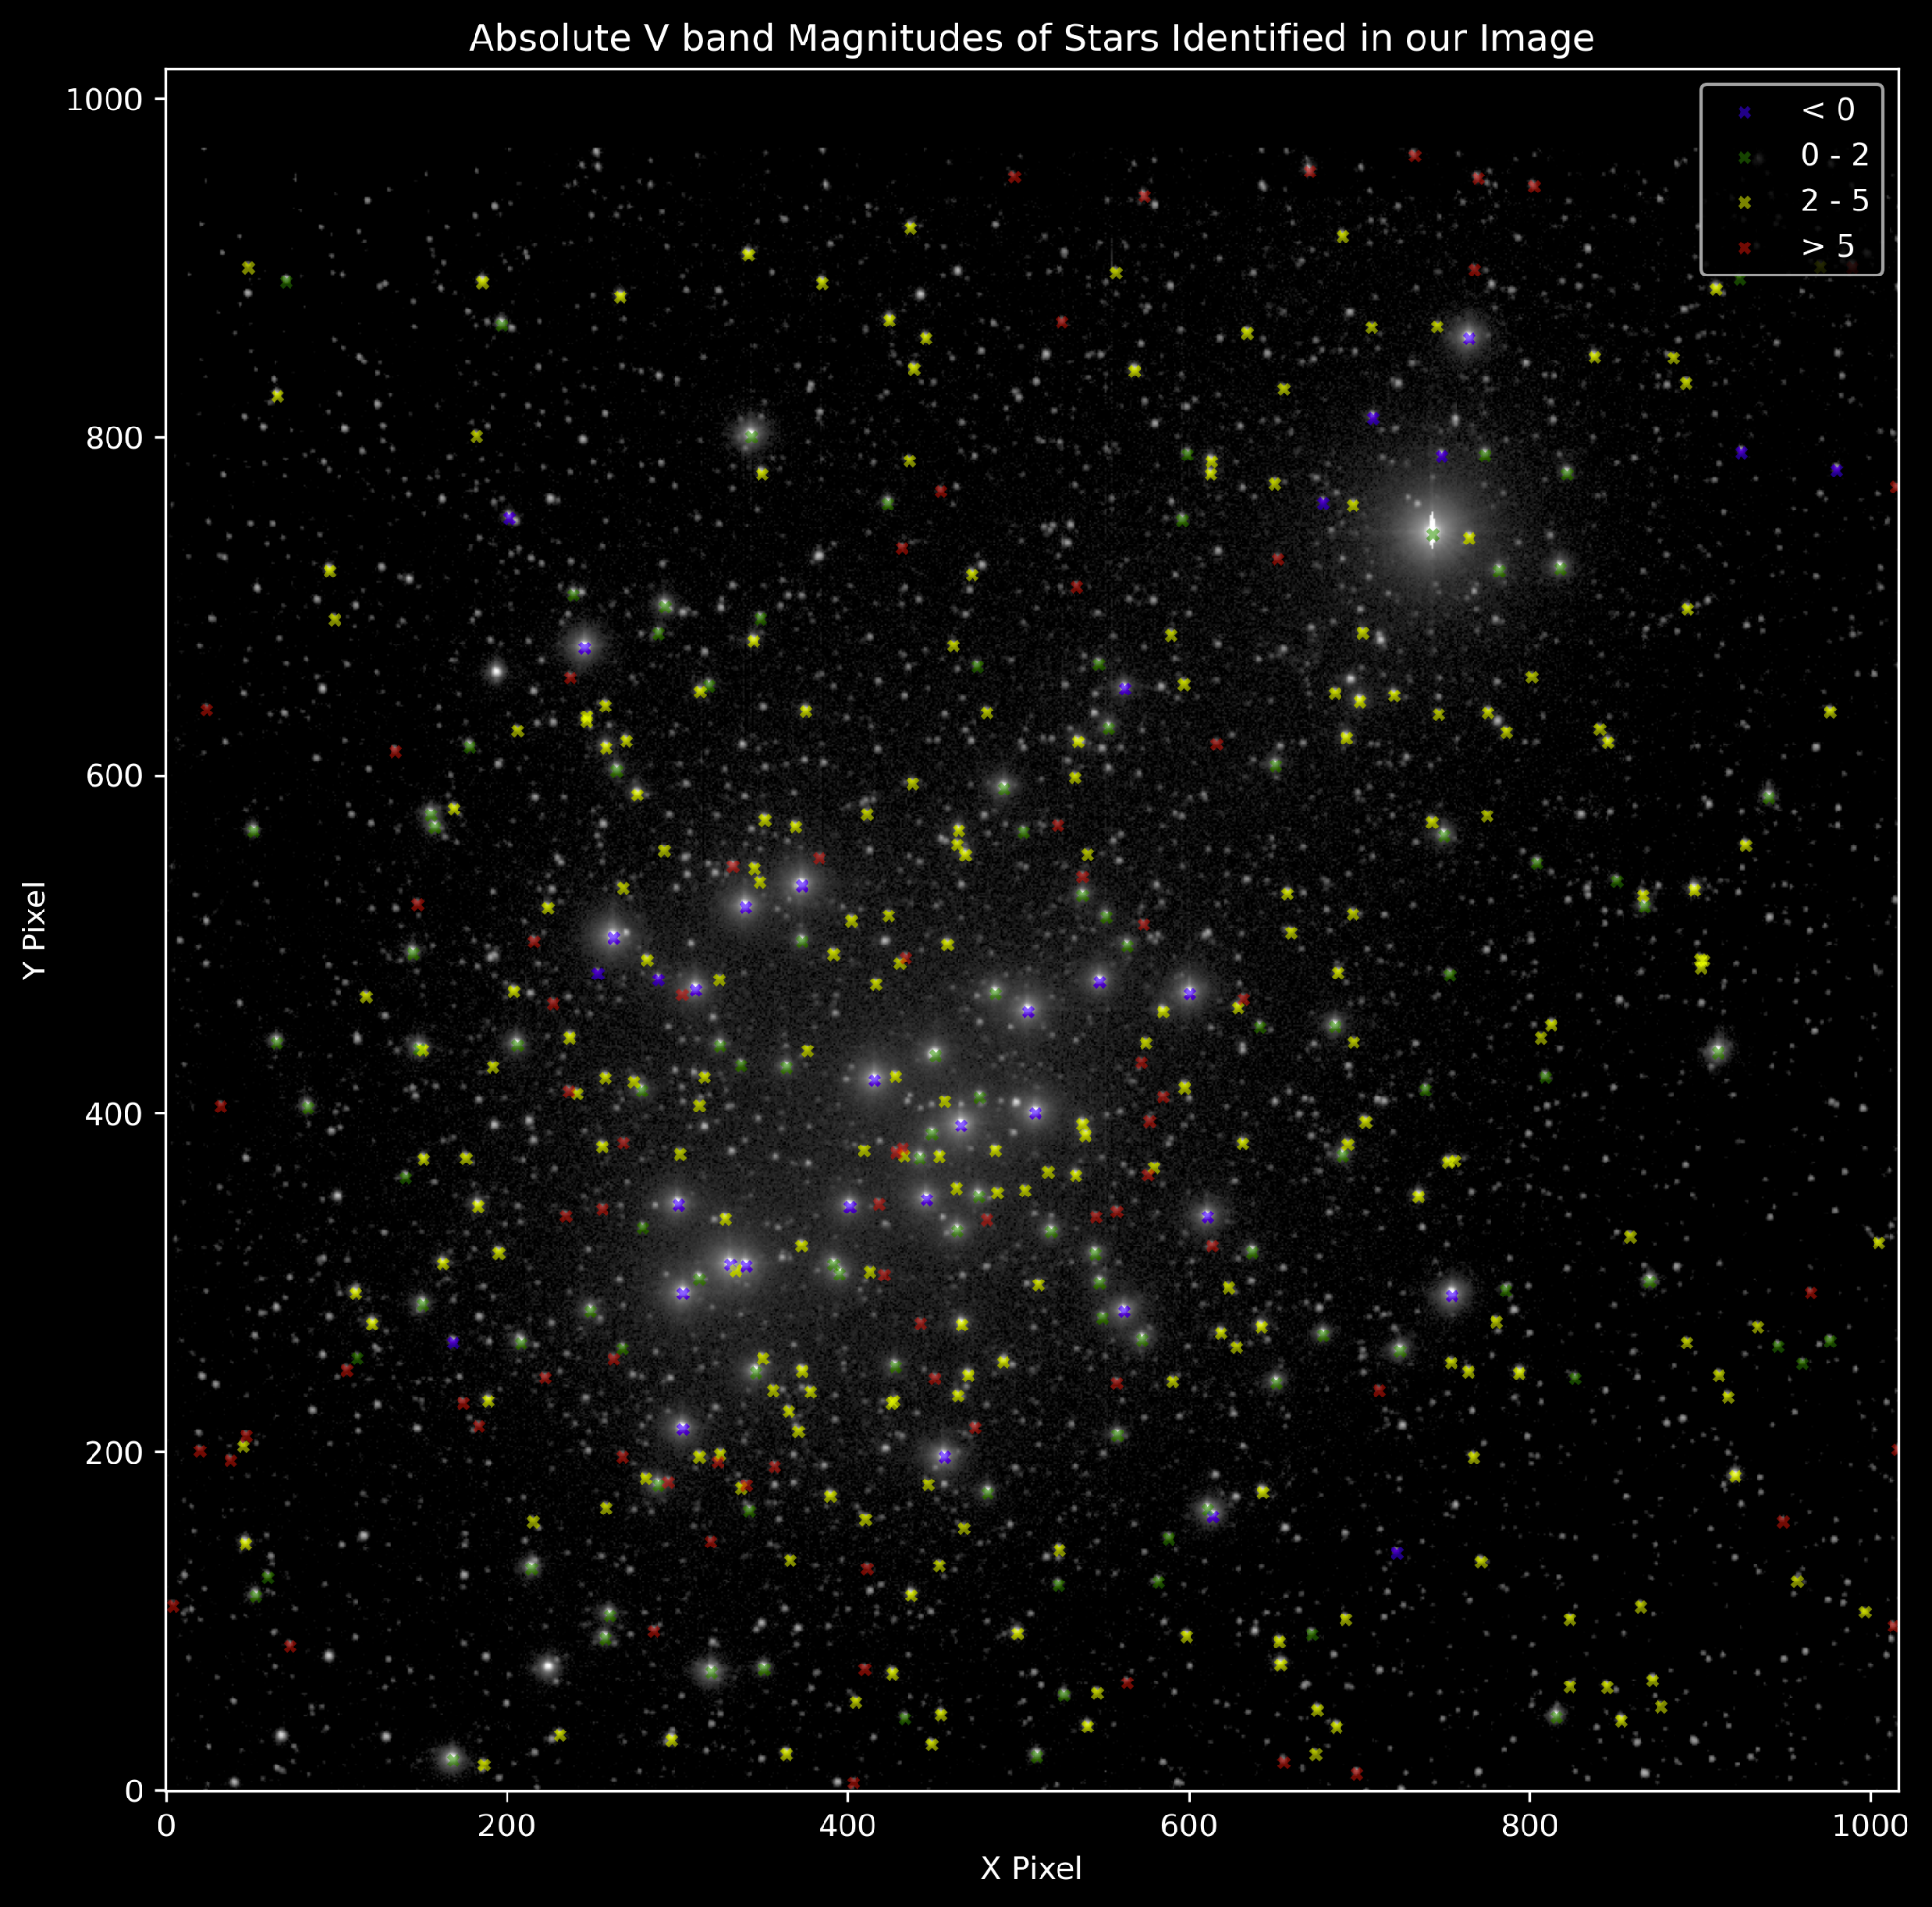
Absolute V band magnitudes after distance correction.
Analysis
The center of mass of the cluster was approximated by taking the median of all σ < 1 star positions. This allowed calculation of the radial distance of each star as the magnitude of the distance vector to that center, enabling examination of relationships between radial distance and other stellar characteristics.
Color-Magnitude Diagram
The CMD revealed a significant difference between cluster and non-cluster stars. Non-cluster stars (high σ) had long since diverged from the main sequence, while cluster members (low σ) were younger and displayed a much clearer structure. The cohesive structure of the cluster members implies they are all around a similar age, having formed around the same time and diverged a similar amount from the main sequence.
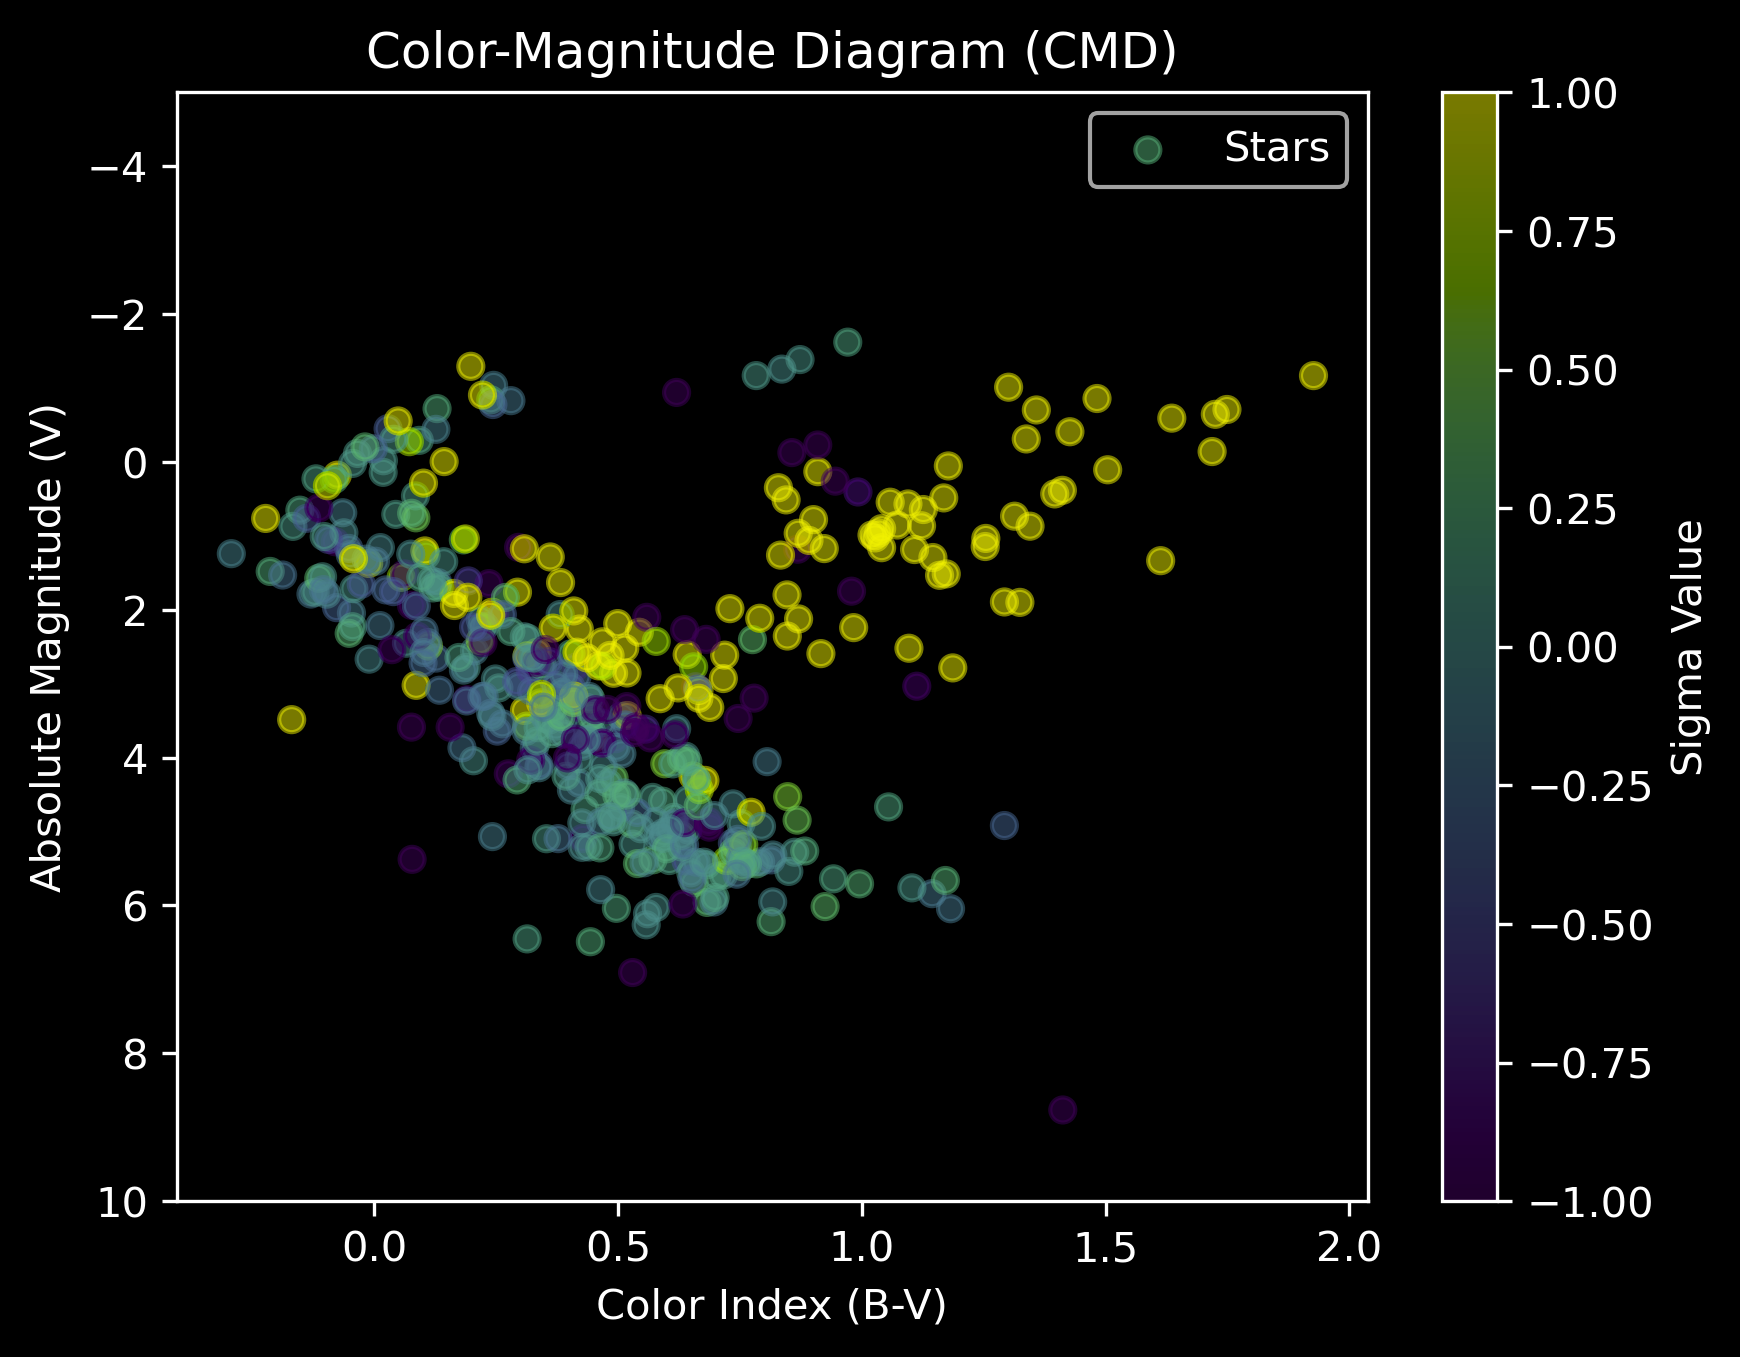
Color-Magnitude Diagram. Colormap corresponds to star σ value.
Color-Color Diagram (B-V vs V-R).
Density vs. Radial Distance
There was a clear linear relationship between stellar density and radial distance from the cluster center. Given the higher density near the center and the relatively young age of the cluster, this implies more star formation occurred near the center of the cluster.
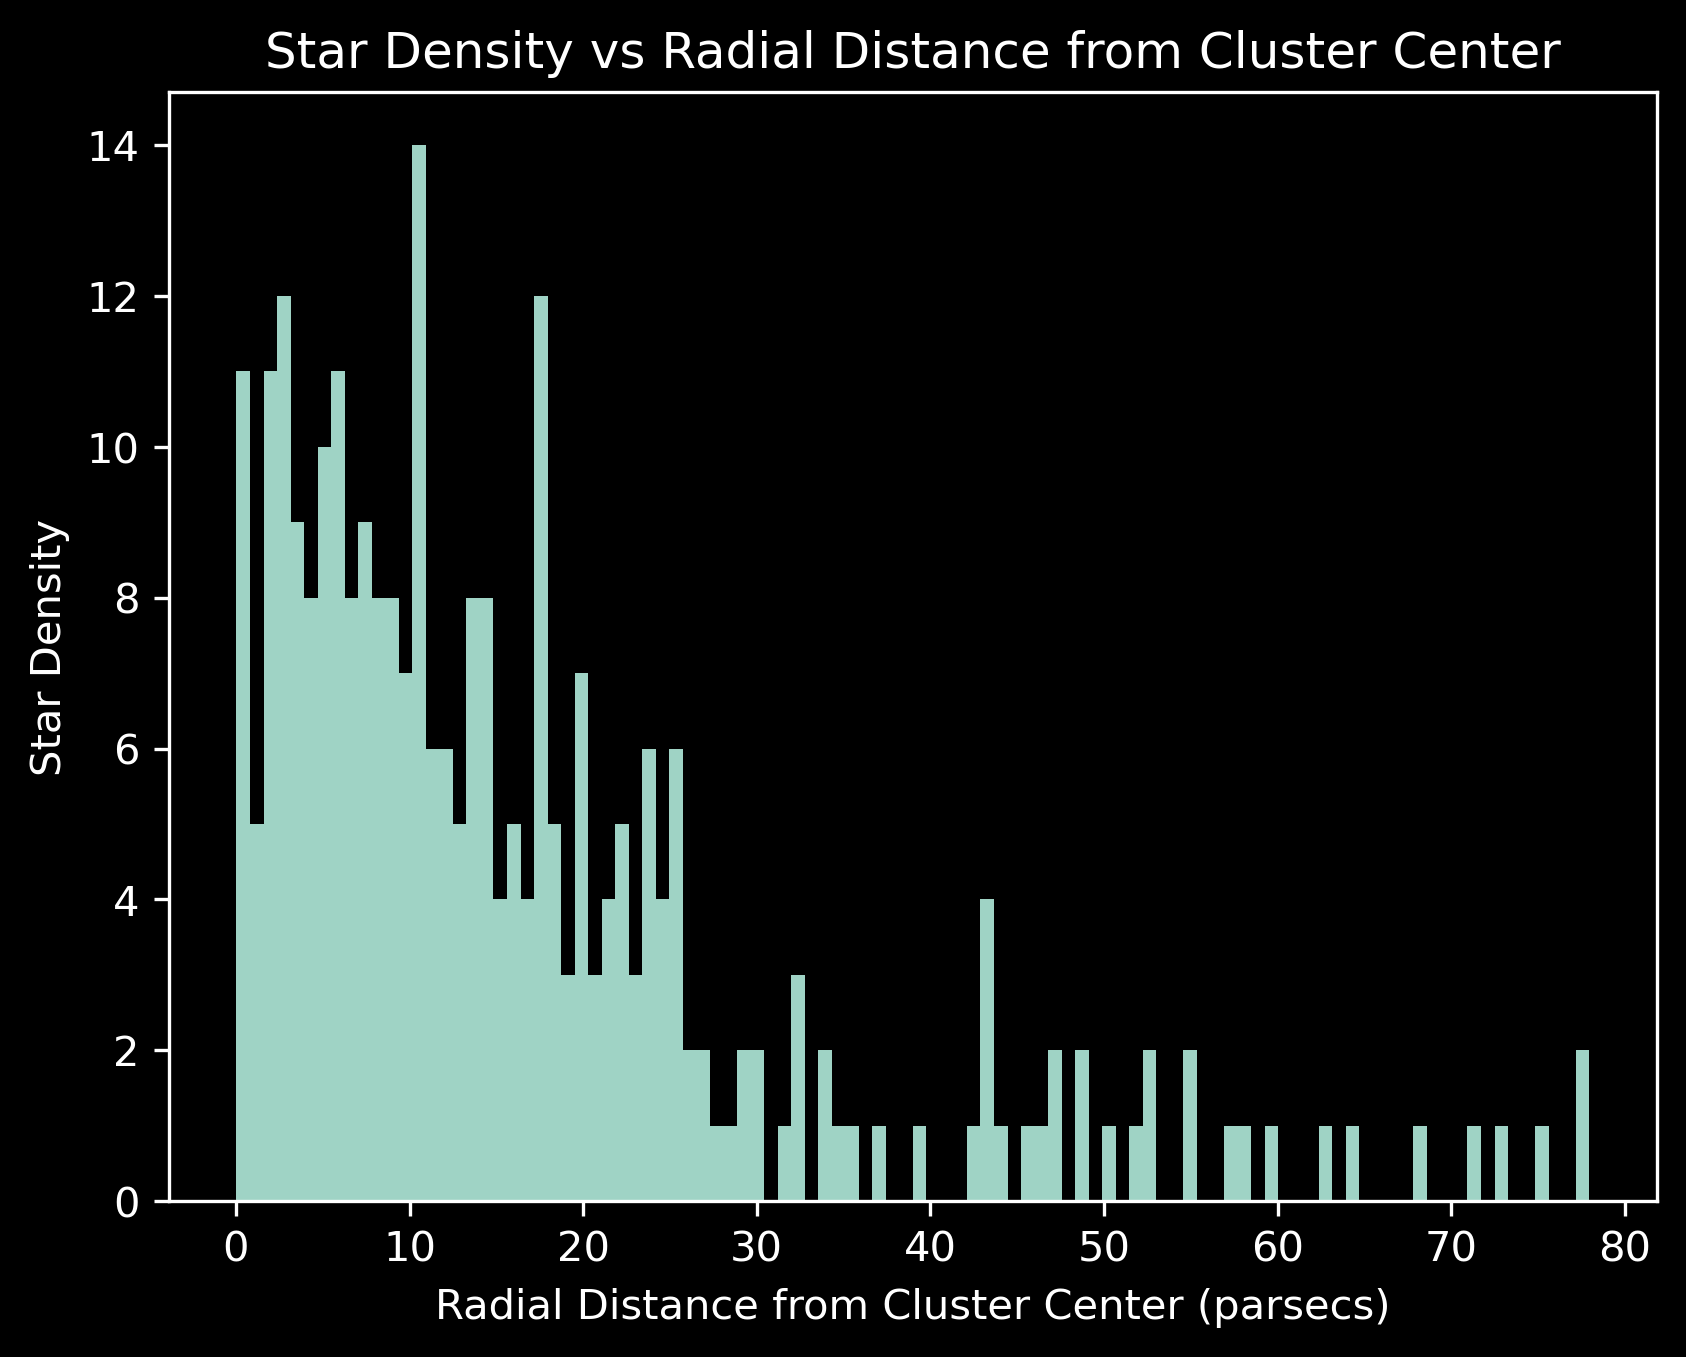
Distribution of radial distance from cluster center for σ < 1 stars.
Color vs. Radial Distance
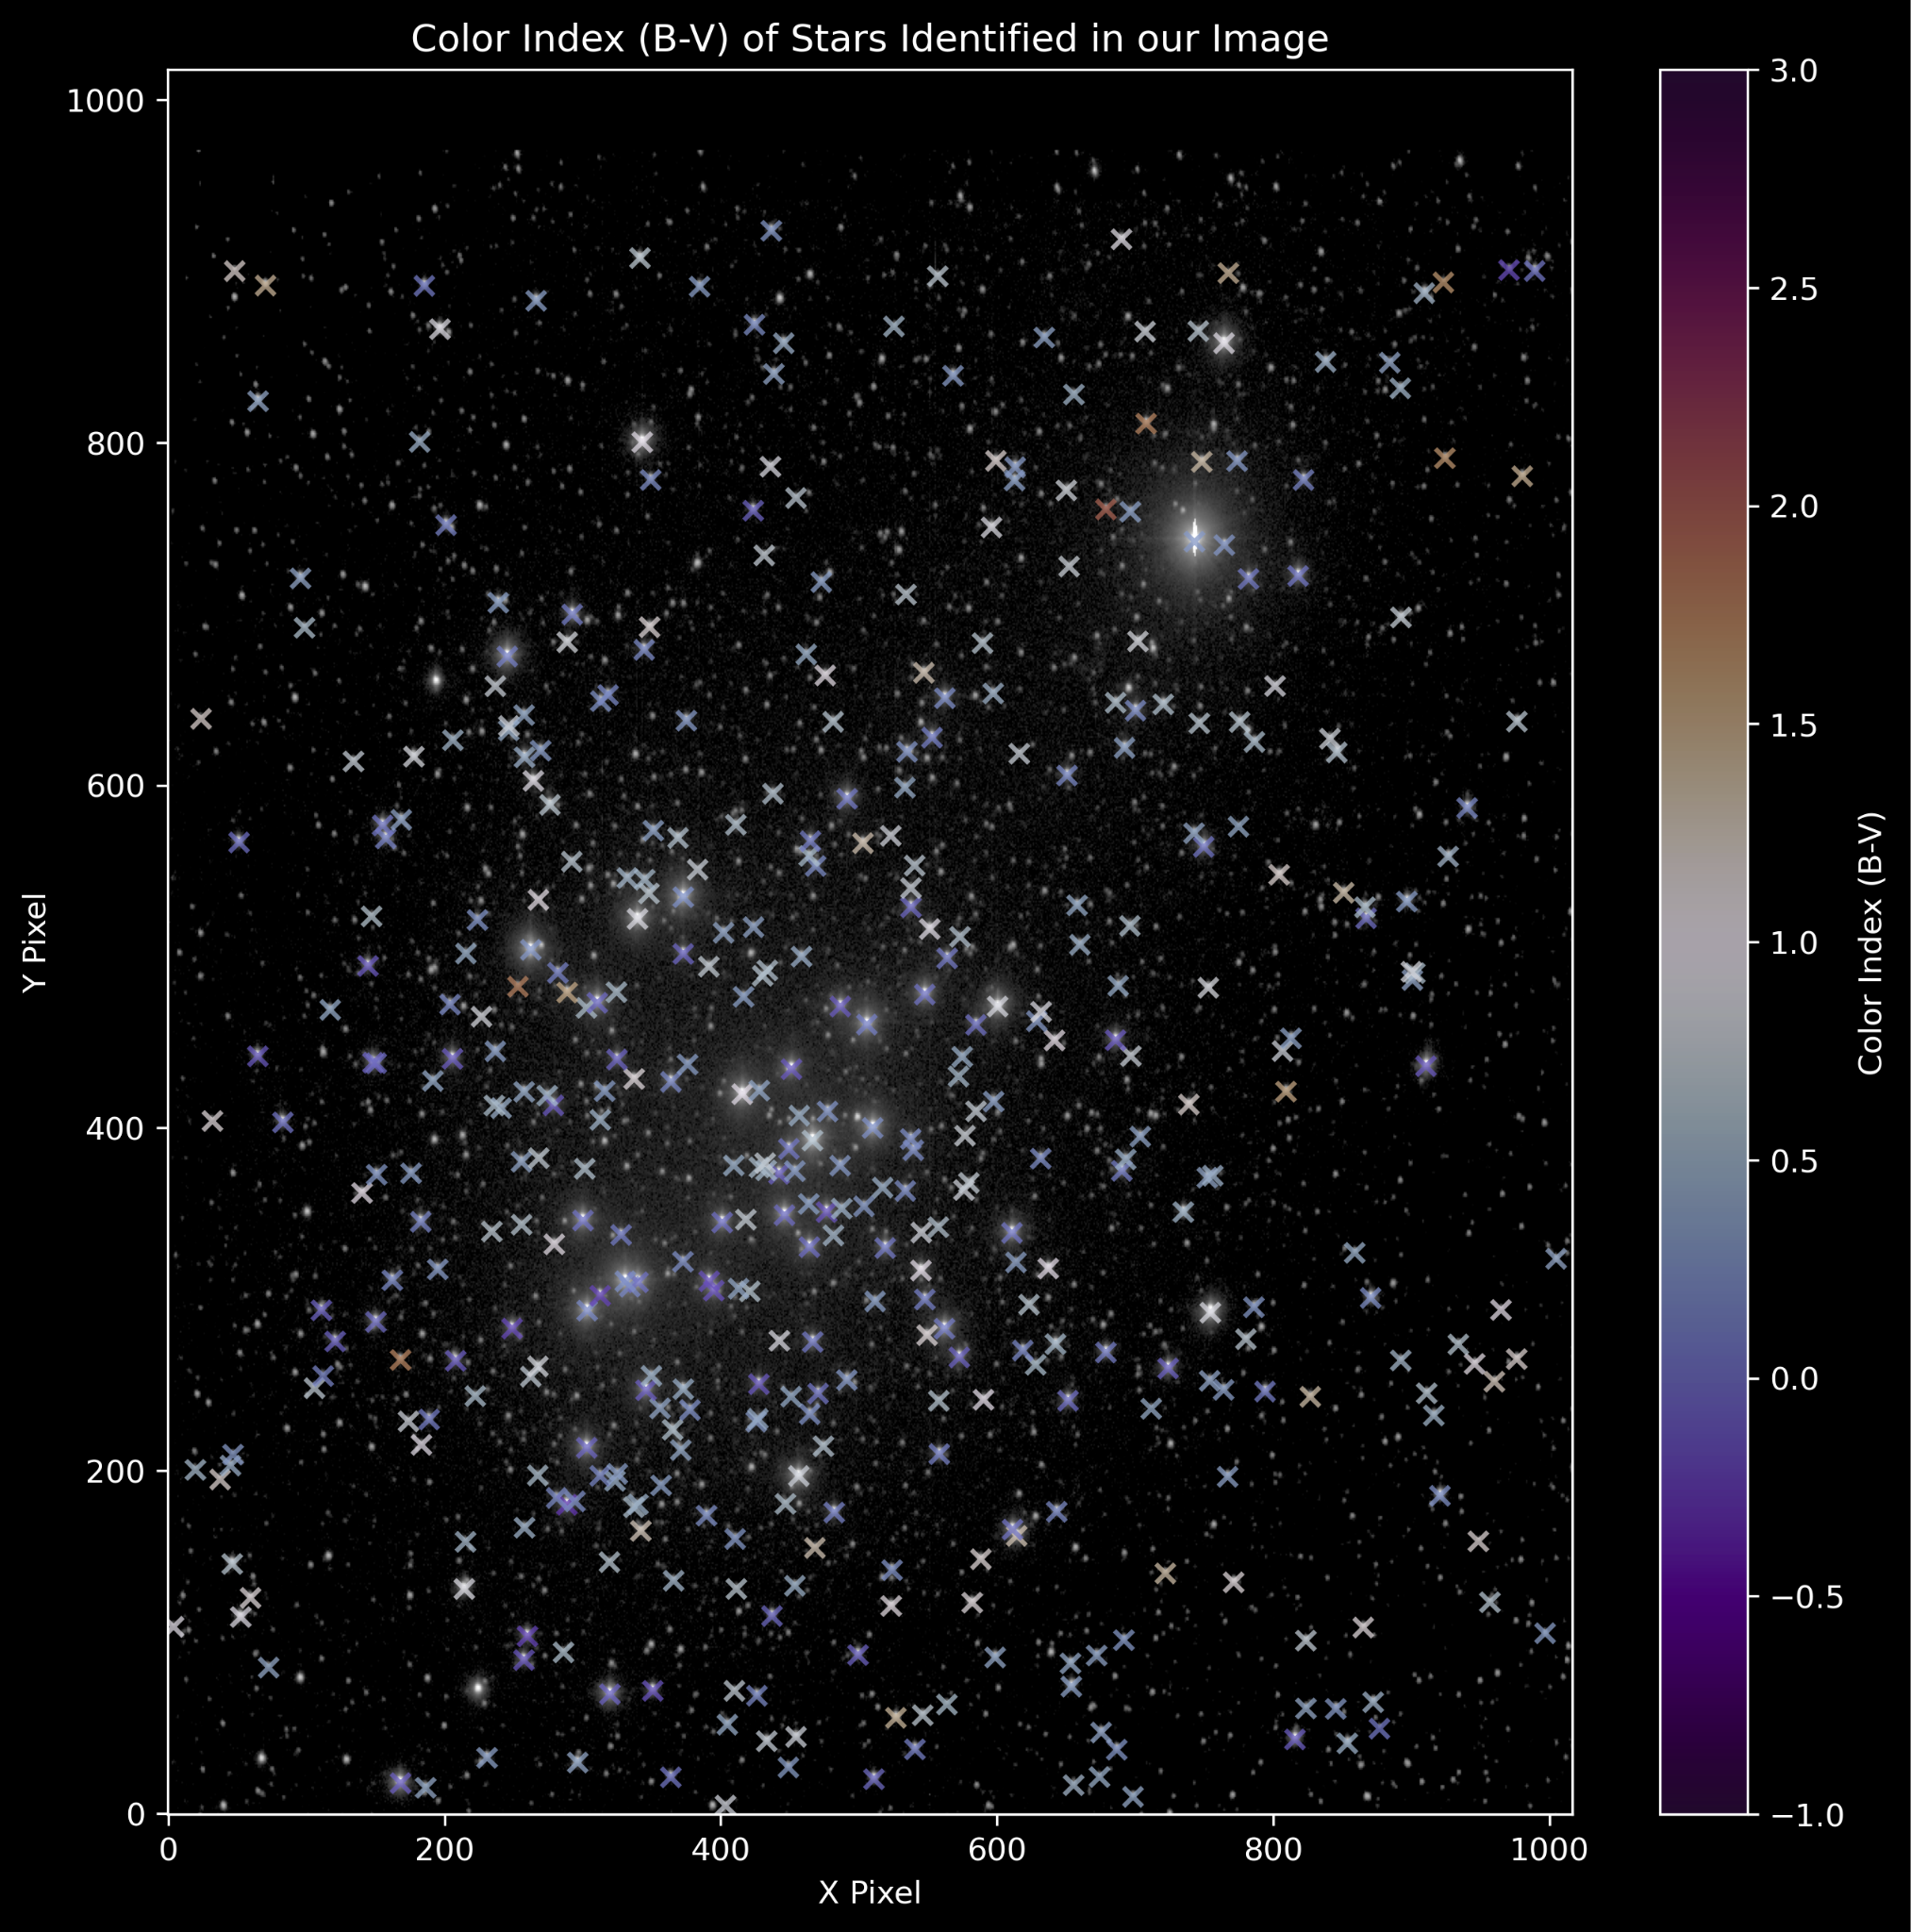
Surprisingly, no significant correlation was found between B-V color and radial distance for cluster members. We had expected more blue (hotter, more massive) stars near the center. The pseudo-random distribution of stellar colors may imply that star formation began at several different locations within the cluster rather than solely at the center.
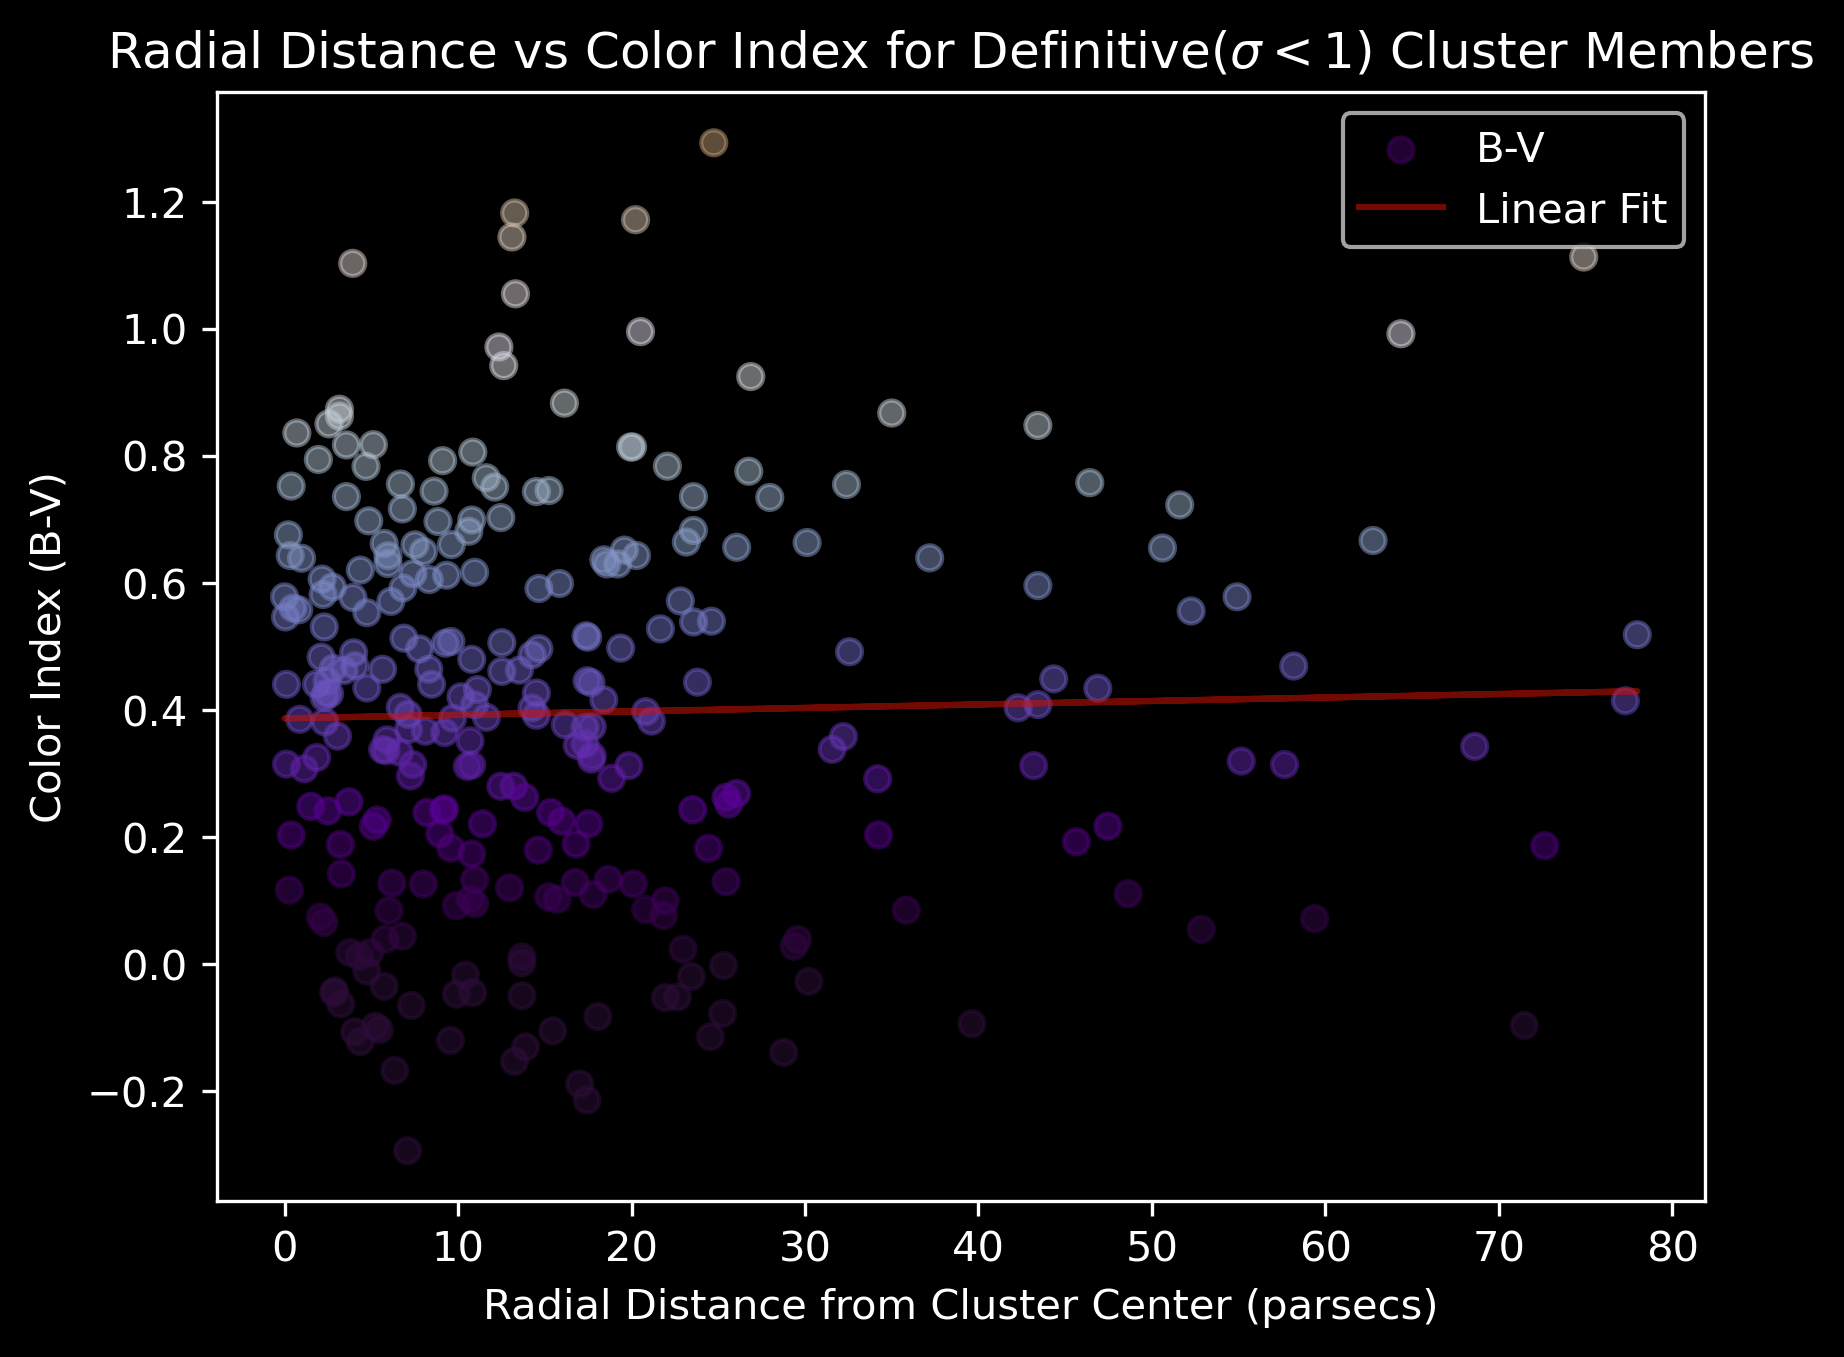
Radial distance vs B-V color. Colormap corresponds to approximate visual star color.
Conclusions
The cluster member stars are visibly younger than surrounding non-cluster stars, are all around the same age, and are indeed generally denser near the center of the cluster than towards the outskirts — partially confirming the original hypothesis.
The color analysis provided a surprising result: the lack of a radial color gradient suggests that star formation may have begun in multiple locations within the cluster rather than solely at the dense center.
Key Findings:
- - Identified 445 known stars with distance data via SIMBAD cross-referencing
- - Cluster members display a cohesive main-sequence structure, implying similar age
- - Clear density gradient: stellar density increases toward the cluster center
- - No significant radial color gradient, suggesting multi-site star formation
Future Work
A more thorough examination of star density using a 3D heatmap could help test the multi-site formation hypothesis. It would also be interesting to explore alternative methods — such as CMD diagram placement or machine learning algorithms — to determine cluster membership for the remaining stars in the images whose distances could not be confirmed via parallax data.
Interactive 3D scatterplot of cluster members, showing spatial distribution and stellar properties.
Acknowledgments
Thanks to Dr. Megan Reiter, Anthony Atkinson, and Richard Xiao for guidance and instruction. Thanks to Roman Rothstein, Noah Oh, and Mikael Graham for debugging help. Tools used include ds9, Stellarium, Airmass.org, Skyview.org, and Astropy.